Expression eFP View
Type a gene ID and click Load gene.
Expression across selected tissues
Mean and median expression
Gene expression heatmap
Candidate genes within selected SNP region
TF search results
Selected TF
Click a row in the TF results table.
TF assignment evidence
Largest transcription-factor families
High-confidence TF marker genes by tissue
TF-family expression across tissues
Gene Ontology enrichment results
Functional annotation results
Editable chickpea chromosome maps
Each selected chromosome is displayed as a separate vertical map with band-style marker positions and SVG download.
Combined marker table
Atlas Downloads
Click a dataset card to download the file.
Chickpea Genomics Atlas
Tennessee State University
Version 3.0
About the Chickpea Genomics Atlas
The Chickpea Genomics Atlas is an interactive web resource developed to visualize gene expression patterns across 32 chickpea tissues and developmental stages. The resource allows users to search individual genes, view tissue-specific expression using an eFP-style atlas, generate expression bar plots, create heatmaps for selected genes, summarize mean and median expression, identify candidate genes near GWAS-associated SNPs, perform Gene Ontology enrichment, examine functional and protein-domain enrichment, and create editable chickpea chromosome maps.
This resource is designed to support candidate gene prioritization, transcriptomic interpretation, seed trait-related functional genomics, GWAS visualization, and molecular breeding research in chickpea.
Development Team
College of Agriculture, Tennessee State University, Nashville, TN, USA
Email: sushantpy8500@gmail.com
ORCID: 0000-0003-3987-5616

College of Agriculture, Tennessee State University, Nashville, TN, USA
Email: kshivash@my.tnstate.edu

Faculty Advisors
College of Agriculture, Tennessee State University, Nashville, TN, USA
Email: lwalla10@tnstate.edu
ORCID: 0000-0002-6985-5854

College of Agriculture, Tennessee State University, Nashville, TN, USA
Email: ali.taheri@tnstate.edu
ORCID: 0000-0002-4019-7982

Credit and Data Source
The RNA-seq data used in this resource were obtained from the publicly available chickpea transcriptome dataset deposited under NCBI BioProject PRJNA622231 (https://www.ncbi.nlm.nih.gov/bioproject/PRJNA622231). This dataset includes transcriptomic profiles from 32 tissues and developmental stages of chickpea cultivar ICC4958 and served as the source of the raw sequencing data used for the analyses presented in this atlas.
Reference:
Jain M, Bansal J, Rajkumar MS, Garg R. An integrated transcriptome mapping the regulatory network of coding and long non-coding RNAs provides a genomics resource in chickpea. Communications Biology. 2022;5:1106. PMID: 36261617.
Transcriptomic Analysis
Publicly available RNA-seq data from BioProject PRJNA622231 were used to examine expression profiles of candidate genes associated with chickpea seed traits. While the original study generated and released the RNA-seq datasets, all downstream transcriptomic processing, expression quantification, data integration, visualization development, and web-resource implementation were performed independently for this project.
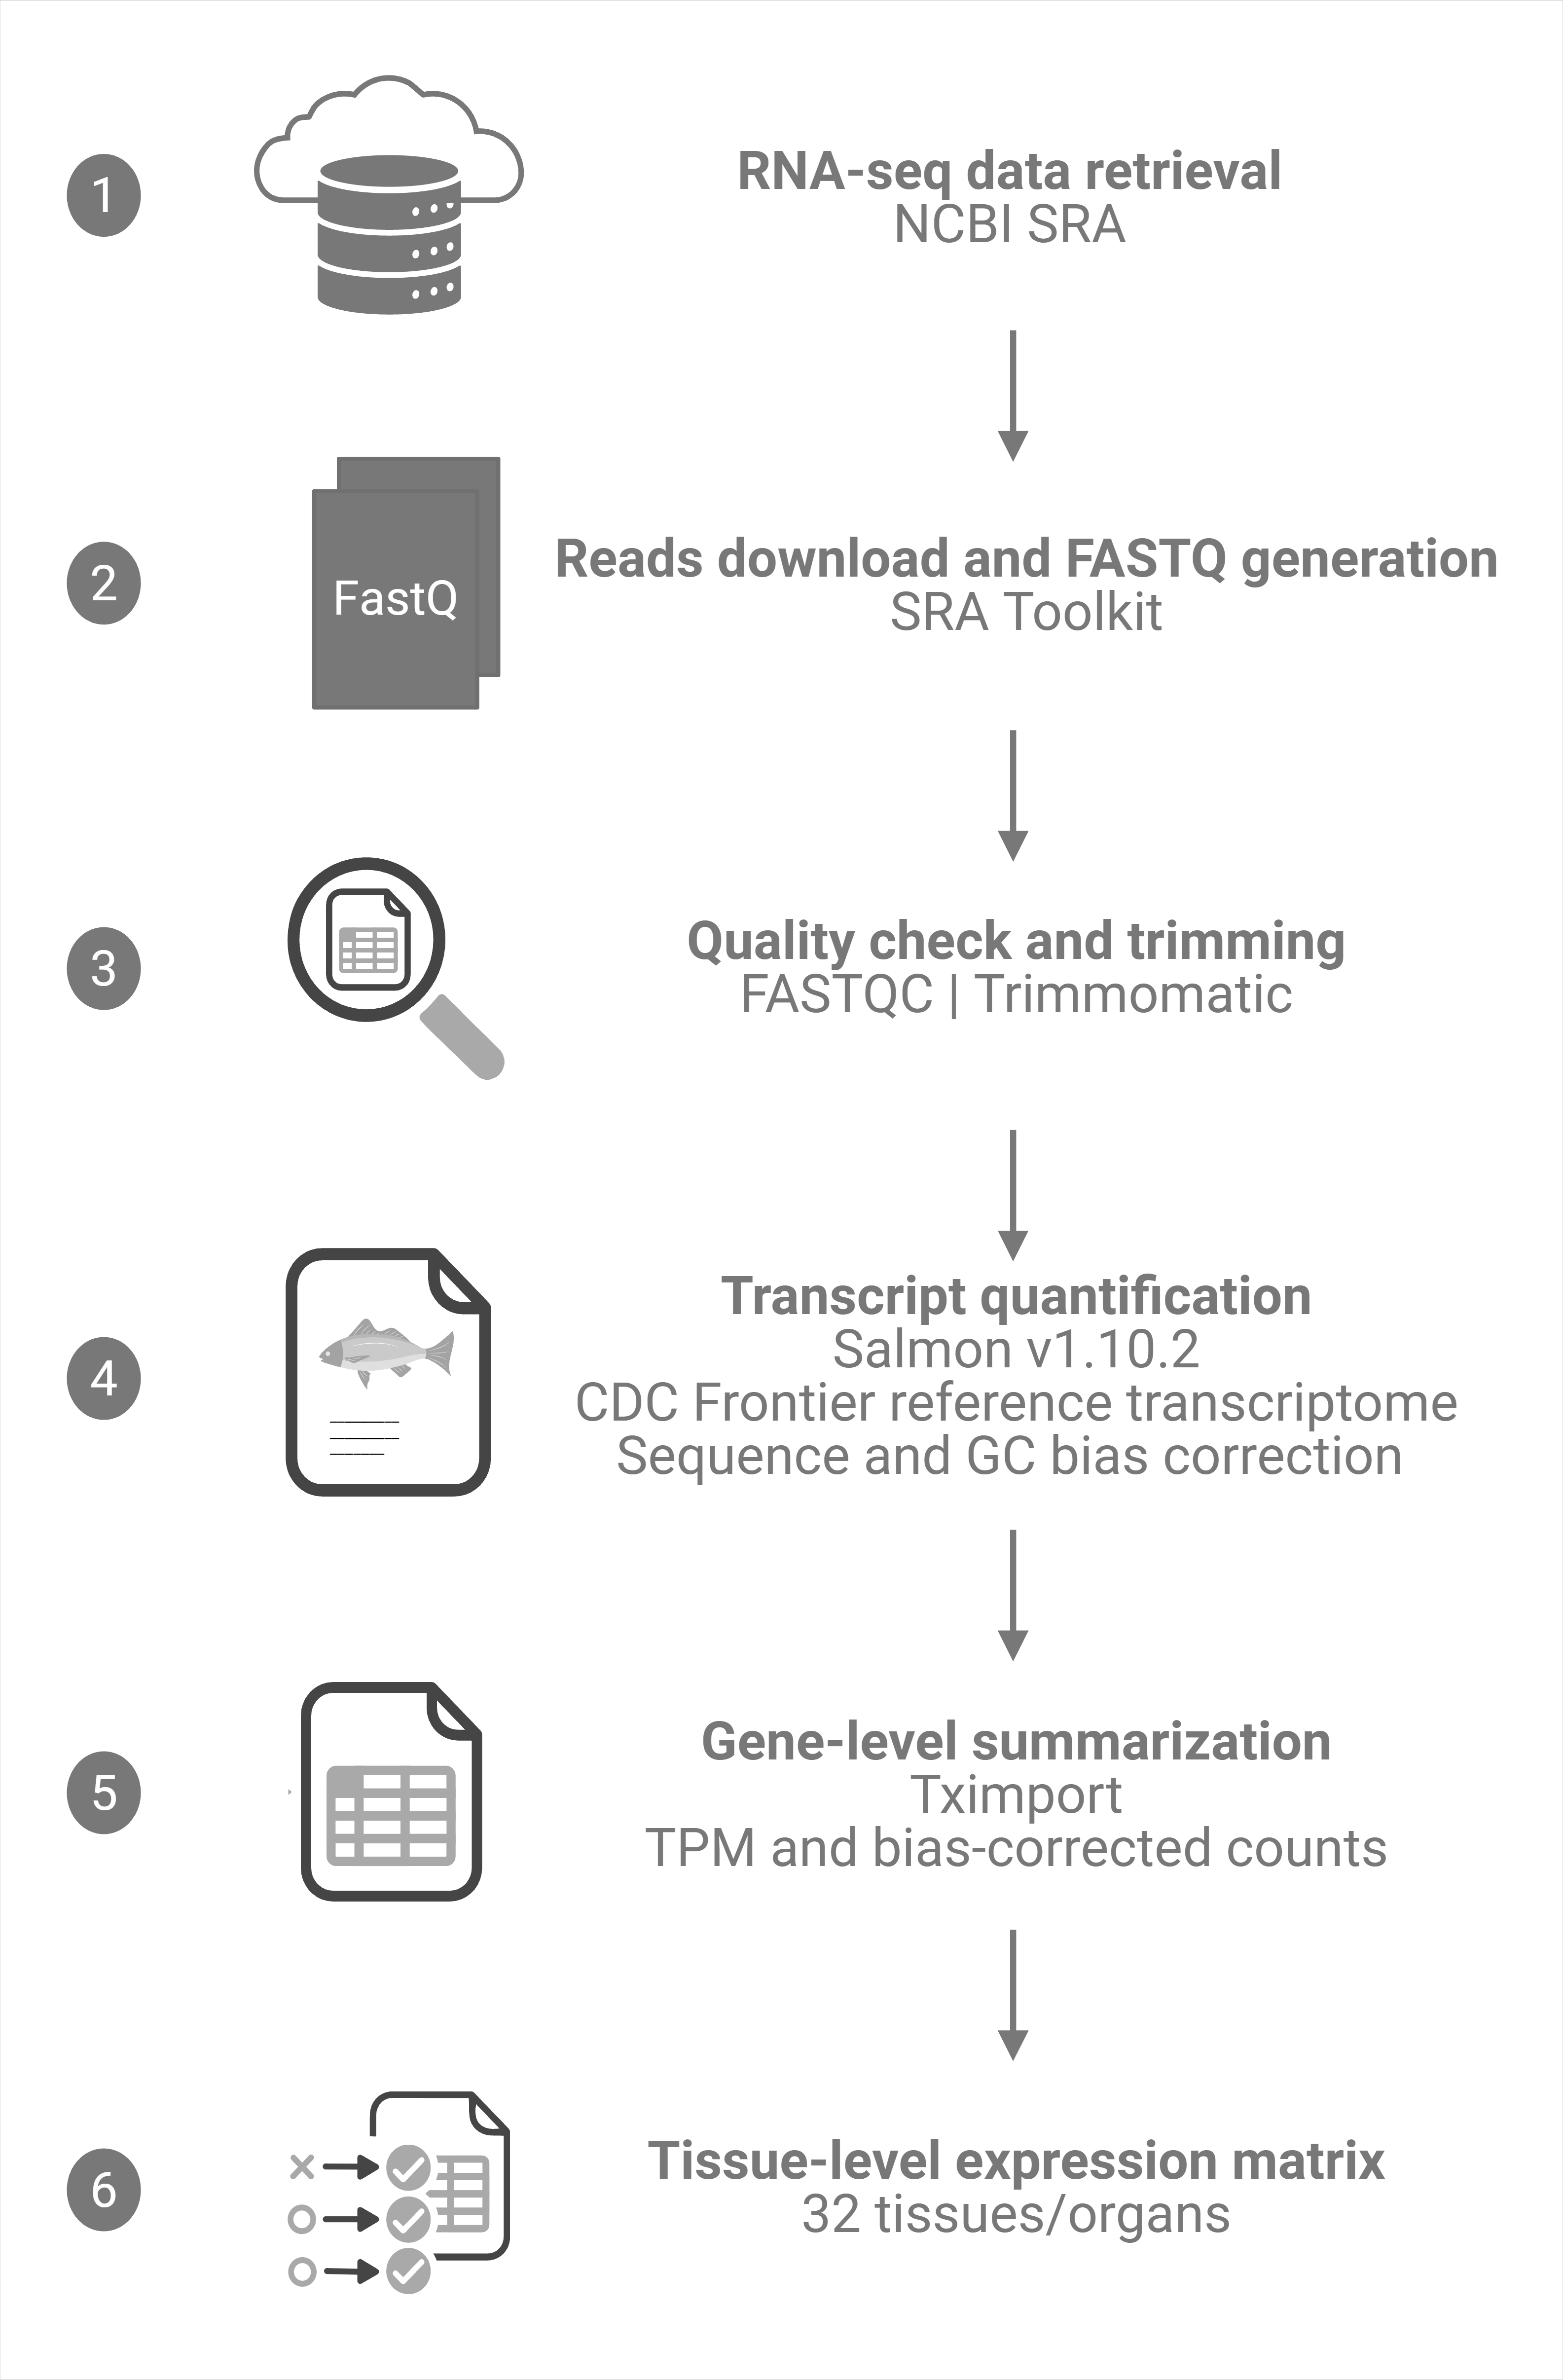
Raw sequencing reads were downloaded from the NCBI Sequence Read Archive using the SRA Toolkit and converted into paired-end FASTQ files. Transcript-level abundance was estimated using Salmon v1.10.2. A Salmon index was generated from the CDC Frontier reference transcriptome file. Salmon quantification files were imported into R using tximport, transcript-level estimates were summarized to gene-level TPM, and biological replicates were averaged within each tissue to generate tissue-level mean TPM expression matrices.
Website Development
The atlas website was developed as a static web application using HTML, CSS, JavaScript, CSV data, and a custom SVG-based chickpea tissue diagram. Tissue-specific SVG elements are dynamically colored based on selected gene expression values.
The website also includes modules for bar plots, heatmaps, mean and median expression summaries, downloadable figures, GWAS candidate gene searches using chromosome, SNP position, upstream/downstream genomic windows, internally background-controlled GO and protein-domain enrichment, predefined gene-set selection from expression classes, tissue groups, individual tissues, marker genes, and housekeeping candidates, and an editable chickpea chromosome mapper based on reference chromosome lengths.
Cite This Atlas
Yadav, S. P. S., Shivashakarappa, K., Taheri, A., & Wallace, L. T. (2026). Chickpea Genomics Atlas: An Interactive Transcriptomic Resource for Tissue-Specific Gene Discovery and Functional Annotation. (Pending).